
The facts about natural disasters are so big and devastating they could make your head explode! You hear about huge costs (like the $360,000,000,000 in damage caused by the 2011 tsunami in Japan), huge speeds (the fastest-moving tsunami waves have been recorded at 500 miles per hour), and even huger mysteries (where, exactly, the danger zones are for natural disasters).
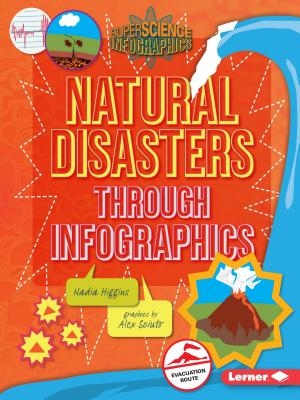
How can all these big numbers and concepts make more sense? Infographics! The charts, maps, and illustrations in this book tell a visual story to help you better understand key concepts about natural disasters. Crack open this book to explore mind-boggling questions such as:
– How can scientists accurately predict natural disasters?
– What were some of Earth’s biggest, freakiest, and deadliest disasters?
– How can you protect yourself in the event of a volcano, an earthquake, or a tsunami?
The answers are sure to shake you up!
Author: Nadia Higgins
Binding Type: Paperback
Publisher: Lerner Classroom
Published: 08/01/2013
Series: Super Science Infographics
Pages: 32
Weight: 0.17lbs
Size: 8.80h x 6.50w x 0.20d
ISBN: 9781467715935
Language: English


Reviews
There are no reviews yet.